 LM Smart Solutions
Distributed power fails quietly — until it fails expensively.
1. Blind sites cost revenue
A battery draining behind a failed rectifier becomes a full outage (SLA penalties, emergency call-outs) when nobody saw the discharge start.
2. Mixed fleets, fragmented tools
Every hardware vendor ships its own portal; operators juggle logins and spreadsheets, and fleet-wide questions take days.
3. Truck rolls replace information
Without remote telemetry and remote config, teams drive to sites just to read a screen or change one setting.
Everything the operations center needs, in one system.
Monitor and control distributed passive infrastructure from a single dashboard, without sending a technician just to read a screen.
Centralized oversight
Monitor and control distributed passive infrastructure through a single, unified dashboard.
Real-time fault detection
Keep uptime and service levels on target with instant alarm tracking.
Comprehensive telemetry
Power systems, HVAC, generators, batteries and smart sensors, all on the same screen.
Remote diagnostics
Analyze alarms and troubleshoot without a physical site visit.
Field coordination
End-to-end issue tracking between the operations team and field technicians.
Automated alerts
Instant notifications by email, WhatsApp and SMS, through integrated providers or a local GSM gateway.
Remote equipment access
Monitor and control every on-site device remotely.
Broad compatibility
Eltek, Enetek, CE+T and other power systems over SNMP and Modbus.
Every site on one screen.
- Unified fleet operations
Telemetry from every power system and smart sensor in a single operational view, filterable by group, template, region and city.
- Real-time status tracking
Live alarms, connectivity state and charge flow for each site. Stale data is flagged, never shown as current.
- Remote, actionable insight
Diagnose from the console, then dispatch field technicians with the site's location and diagnostics in hand.
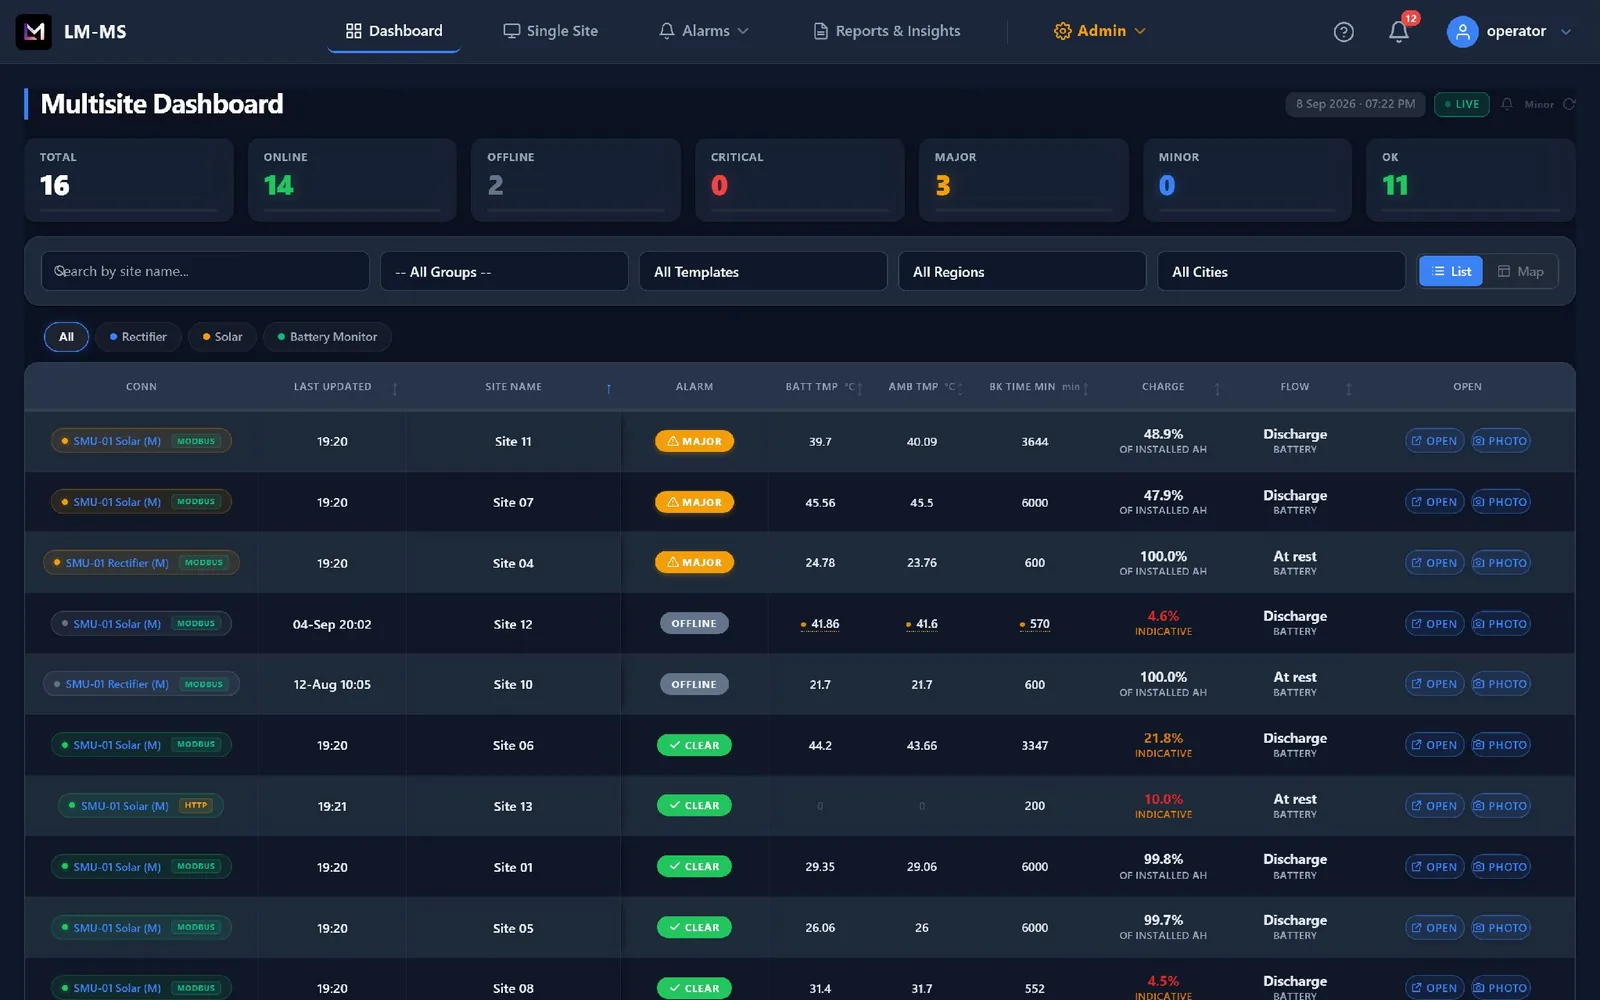
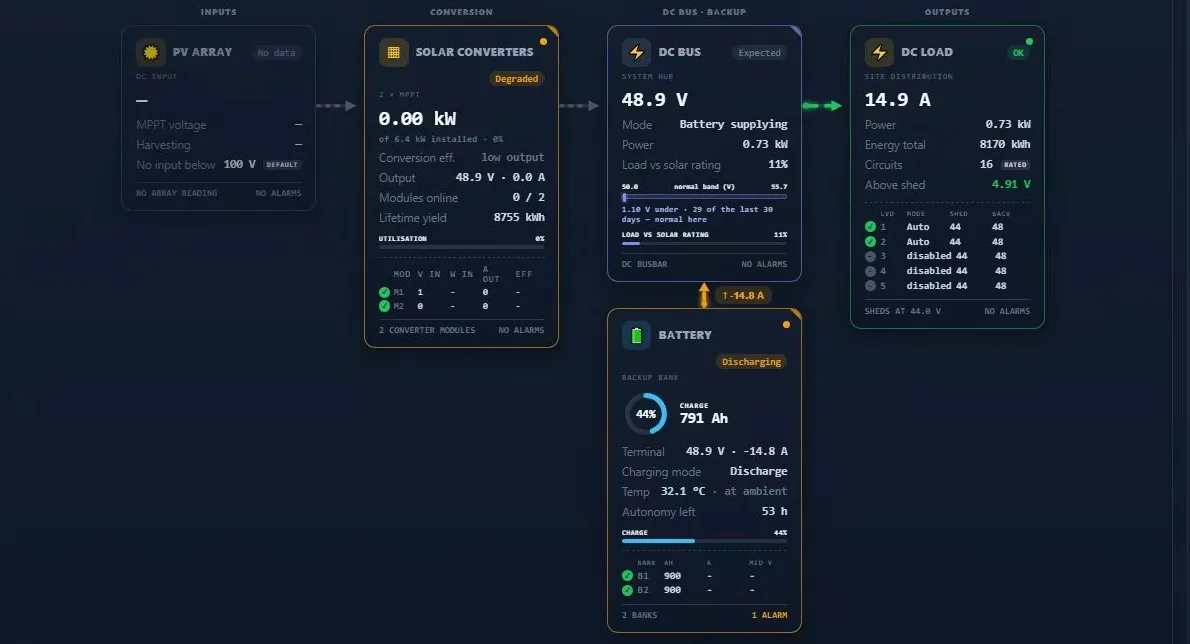
From the whole fleet down to a single converter module.
- Fleet oversight
A central console tracks how fresh every reading is, so an operator never acts on stale data.
- Customizable dashboards
Choose, create or modify dashboard templates for each team.
- Geospatial mapping
Sites on a map, grouped by severity. Sites without coordinates are listed, not silently dropped.
- Site visualization
Clear diagrams with live values for the array, converters, DC bus, battery bank and load.
- Plain-language status
"Night, running on battery", "Mains feeding", "At rest": plant conditions an operator reads at a glance.
Every site drills down into
- Overview
- Battery
- Solar
- Load & Distribution
- System & I/O
- Alarms
- Events
- Trends
Trends cover availability, outages, MTBF, energy consumed, time on battery and recurring alarms over 24 hours, 7 days or 30 days.
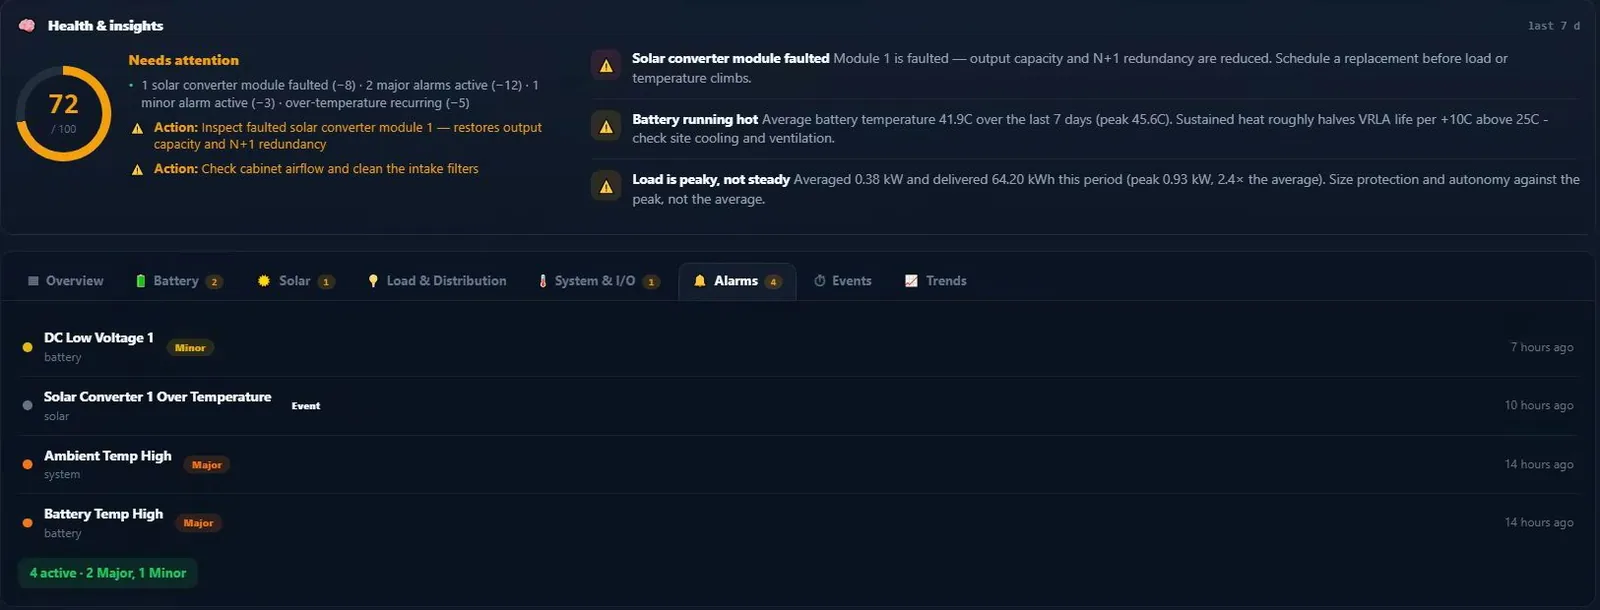
Health, scored and explained.
LM-MS reconciles each controller's own event log against the alarm history, correcting for device clock offsets and catching events shorter than the poll interval.
Scoring framework
Every site starts at 100. Each deduction is itemized and capped, so the score always shows why it moved.
- 80+Healthy Optimal performance
- 60–79Needs attention Degraded performance
- < 60At risk Critical action required
Actionable insights
More than 20 generated insights. Each one states the measurement, the consequence and the corrective action. For example: "Battery running hot, sustained heat roughly halves VRLA life, check site cooling and ventilation."
Reports, run against the live history.
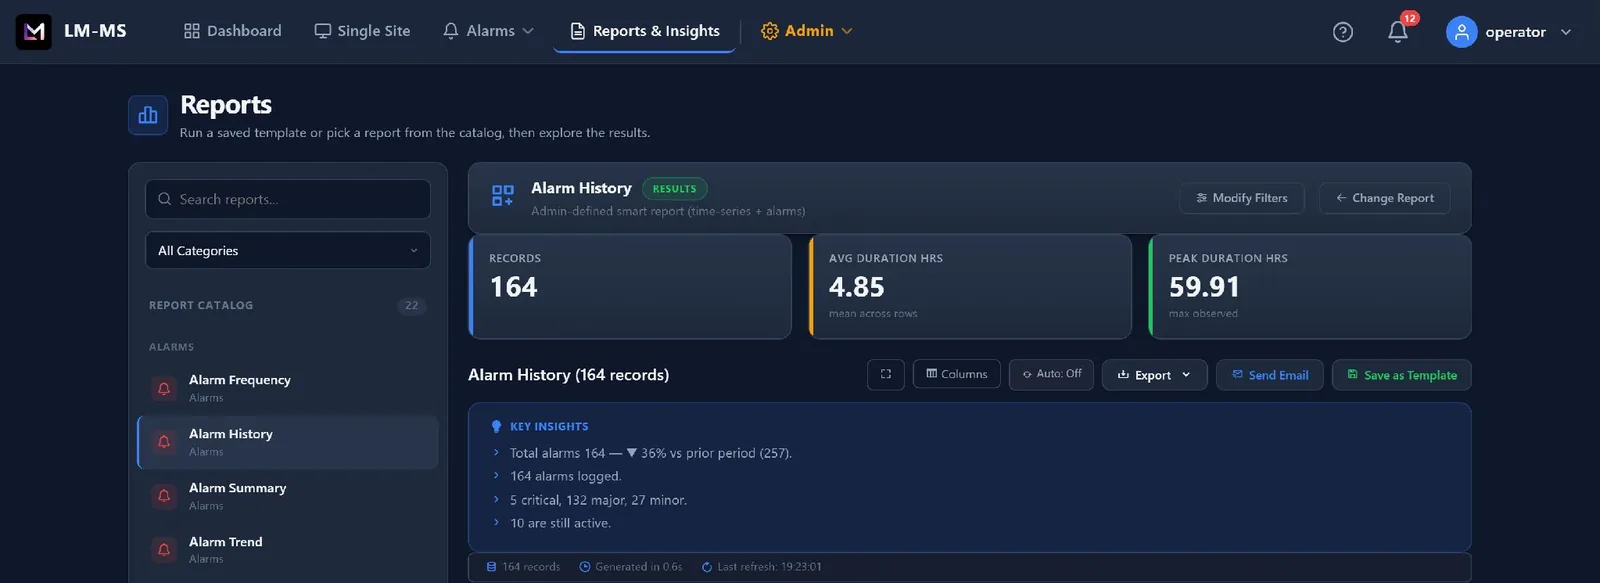
- Flexible reporting
20+ report templates covering alarms, health and power, on demand or on an automated schedule.
- Comparative analysis
Side-by-side reliability, energy and battery comparisons for two to four sites, exported to PDF.
- Performance analysis
Alarm handling and operator performance across the fleet: alarms handled, actions taken, affected sites, average resolution time, severity mix and the sites with the most alarms. From a day to a year, exported as CSV or sent by email.
The right alarm, to the right people.
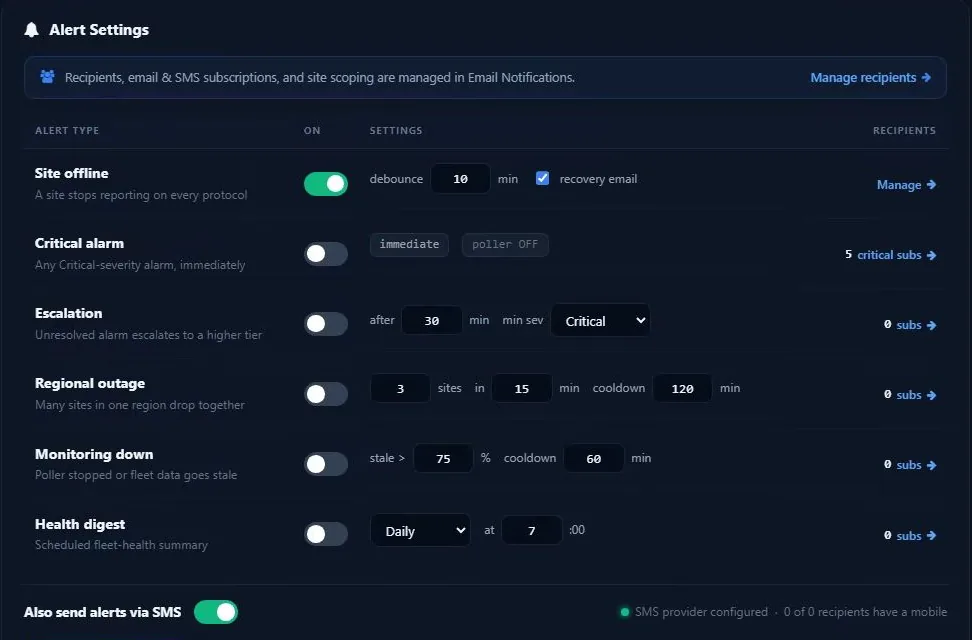
- Configurable alert types
Site offline with debounce, critical alarms, escalation, regional outage, monitoring down and a scheduled health digest, each switched on or off as needed.
- Severity-based prioritization
Critical, major and minor, sorted worst-first in every view.
- Subscriber rules
Notification preferences per subscriber, filtered by alarm type, severity and site, with "raise" and "clear" as separate triggers.
- Episode tracking
Start time, end time and total duration of every alarm, for audit reliability and response SLAs.
- Multi-channel delivery, fully logged
Email, SMS or WhatsApp per rule, and a record of every notification attempt linked to the alarm that triggered it.
Change settings remotely, with a record of every change.
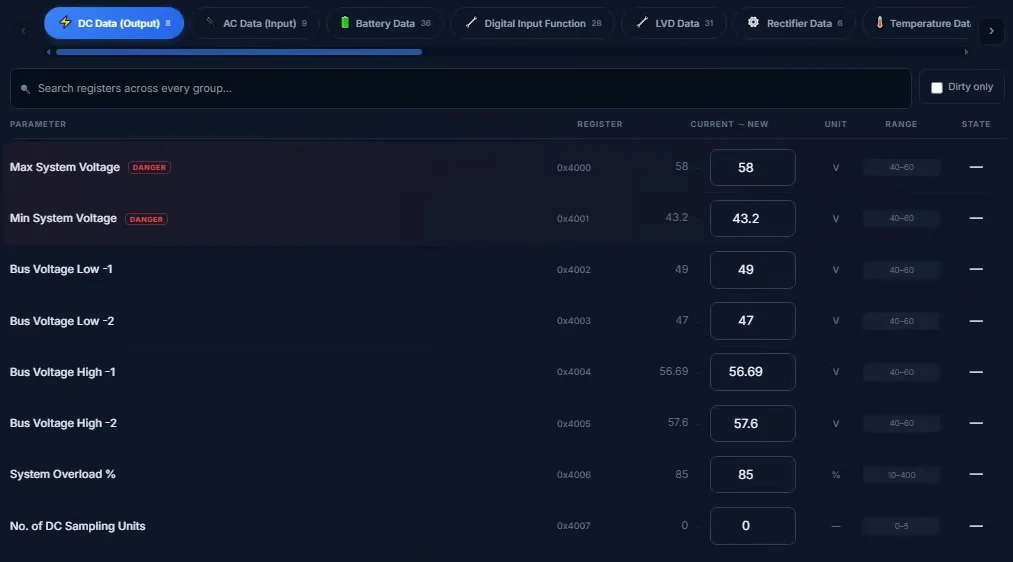
Verified configuration writing
See and edit a device's configuration directly: current and new value for every parameter, its allowed range, and a warning on sensitive settings.
Bulk configuration
Deploy the same settings from a reference device to many sites at once, filtered by region or device type.
Audit trail, baselines & profiles
Every change is logged, reference baselines show when a site drifts, and saved profiles keep configurations consistent.
- Eltek
- Enetek
- CE+T
- SNMP
- Modbus
Enterprise comparisons.
| Feature Area | LM-MS | Galooli | Asentria (SiteBoss) | Vertiv / Huawei NetEco |
|---|---|---|---|---|
| Integration model | multi-vendor, catalog-driven, Modbus+SNMP+HTTP with AUTO fallback | cloud SaaS, strongest with own gateway | hardware-first per-site controllers | deepest with same-vendor power hardware |
| Deployment & data ownership | on-premise, your servers, your data, full offline | vendor cloud, data off-site | on-site devices + central software | enterprise DCIM, heavy install |
| Storage architecture | lean change-gated, bounded live store, automated retention | managed cloud, per-site fees typical | event/log on-box | full DCIM databases |
| Cost model | licensed, no per-site subscription, no per-GB metering | recurring per-site/asset subscription | per-site capex + software | enterprise licensing tied to hardware estate |
| Plant visualization | animated adaptive power flow + rule-based health scoring | fleet KPIs/asset dashboards | status/event views | data-center topology views |
| Reporting | zero-code builder, in-place editing, scheduled e-mail, exec PDF | cloud analytics packages | event exports/SNMP forwarding | enterprise reporting modules |
* Competitor characteristics reflect publicly available positioning; evaluate current vendor offerings directly for procurement decisions.
See your fleet the way LM-MS sees it.
We'll walk you through the console with your site types, alarm rules and reports.
- Salesinfo@lm-tech-solutions.com
- Technical leadlaila@lm-tech-solutions.com
- Phone+20 128 888 2032